“Diving Deep: A Comprehensive Guide to Debugging Tools
Artikel Terkait Diving Deep: A Comprehensive Guide to Debugging Tools
- The Symphony Of Sound: A Deep Dive Into Voice Recognition Technology
- The Dawn Of Seamless Interaction: Exploring The Power Of Smart Interfaces
- The Silent Killer: Understanding And Managing Technical Debt
- The Hybrid Cloud: Bridging The Gap Between Tradition And Innovation
- Federated Learning: Training AI Without Sharing Data
Table of Content
Video tentang Diving Deep: A Comprehensive Guide to Debugging Tools
Diving Deep: A Comprehensive Guide to Debugging Tools

Debugging, the art of finding and fixing errors in software, is an essential part of the software development lifecycle. While writing code is often seen as the creative and exciting part, debugging is the crucial, often painstaking, process that ensures our creations function as intended. Fortunately, developers have a vast arsenal of debugging tools at their disposal, each designed to tackle specific types of errors and workflows. This article will explore a range of these tools, from the fundamental to the more advanced, empowering you to become a more effective and efficient debugger.
I. Understanding the Landscape: Types of Debugging Tools
Before diving into specific tools, it’s important to understand the broad categories they fall into. This categorization helps you choose the right tool for the job.
-
Integrated Development Environment (IDE) Debuggers: These are often the first line of defense. Integrated directly into your code editor, they offer a suite of features for stepping through code, setting breakpoints, inspecting variables, and evaluating expressions. Examples include the debuggers built into Visual Studio, IntelliJ IDEA, Eclipse, and VS Code.
-
Command-Line Debuggers: For developers comfortable with the command line, tools like GDB (GNU Debugger) and LLDB offer powerful debugging capabilities. They are particularly useful for debugging low-level code, embedded systems, and server-side applications.
-
Logging and Monitoring Tools: These tools focus on capturing and analyzing application behavior over time. They help identify issues that are difficult to reproduce in a controlled environment, such as performance bottlenecks or intermittent errors. Examples include logging frameworks like log4j, Serilog, and tools like Prometheus and Grafana for monitoring system metrics.
-
Static Analysis Tools: These tools analyze code without actually executing it, identifying potential errors, security vulnerabilities, and code quality issues. They help prevent bugs before they even reach the runtime environment. Examples include SonarQube, FindBugs, and ESLint.

-
Memory Debuggers: These specialized tools help detect memory leaks, buffer overflows, and other memory-related issues, which can be notoriously difficult to track down. Examples include Valgrind and AddressSanitizer (ASan).
Network Debuggers: These tools allow you to inspect network traffic, analyze HTTP requests and responses, and diagnose network-related issues. Examples include Wireshark, Fiddler, and browser developer tools.
-
Browser Developer Tools: Every modern web browser comes equipped with a powerful set of developer tools that allow you to inspect HTML, CSS, and JavaScript, debug network requests, and profile performance.

II. Core Debugging Techniques and Tools in Action
Let’s explore some of the most common debugging techniques and the tools that support them.
-
Print Statements (The Old Reliable): While seemingly basic, strategically placed print statements (or console logs) can be incredibly effective for understanding the flow of execution and inspecting variable values. They are particularly useful for debugging simple issues or in environments where more sophisticated debugging tools are not available.
- Example: In Python:
print(f"Value of x: x, Value of y: y") - Example: In JavaScript:
console.log("Value of myVariable:", myVariable);
- Example: In Python:
-
Breakpoints: Breakpoints are markers in your code that tell the debugger to pause execution at a specific line. This allows you to inspect the state of the program at that point, step through the code line by line, and identify the source of the error.
- Using an IDE Debugger: Most IDEs allow you to set breakpoints by clicking in the gutter next to the line number.
- Using a Command-Line Debugger (GDB):
break <line_number>orbreak <function_name>
-
Stepping Through Code: Stepping through code allows you to execute your code one line at a time, observing the changes in variable values and the flow of execution.
- Step Over: Executes the current line and moves to the next line in the same function.
- Step Into: If the current line is a function call, steps into the function being called.
- Step Out: Executes the remaining code in the current function and returns to the calling function.
-
Inspecting Variables: Debuggers allow you to inspect the values of variables at any point during execution. This is crucial for understanding how data is being manipulated and identifying unexpected values.
- Using an IDE Debugger: Most IDEs provide a dedicated "Variables" or "Watch" window where you can see the values of variables in the current scope.
- Using a Command-Line Debugger (GDB):
print <variable_name>
-
Evaluating Expressions: Debuggers allow you to evaluate arbitrary expressions in the context of the current execution point. This can be useful for testing hypotheses, calculating values, and understanding complex logic.
- Using an IDE Debugger: Most IDEs provide a dedicated "Evaluate Expression" window or allow you to evaluate expressions directly in the "Watch" window.
- Using a Command-Line Debugger (GDB):
print <expression>
-
Conditional Breakpoints: Conditional breakpoints allow you to set breakpoints that only trigger when a specific condition is met. This is useful for debugging issues that only occur under certain circumstances.
- Example: Set a breakpoint that only triggers when
x > 10.
- Example: Set a breakpoint that only triggers when
-
Watch Expressions: Watch expressions are expressions that the debugger continuously monitors and displays the value of. This is useful for tracking the value of a variable or expression over time.
-
Memory Debugging with Valgrind: Valgrind is a powerful memory debugging tool that can detect memory leaks, invalid memory access, and other memory-related errors. It’s particularly useful for debugging C and C++ applications.
- Example:
valgrind --leak-check=full ./my_program
- Example:
-
Network Debugging with Wireshark: Wireshark is a network protocol analyzer that allows you to capture and analyze network traffic. It’s useful for diagnosing network-related issues, such as slow network performance or incorrect data transmission.
- Capturing and Filtering Traffic: Wireshark allows you to capture network traffic and filter it based on various criteria, such as IP address, port number, and protocol.
III. Advanced Debugging Techniques
Beyond the basics, several advanced debugging techniques can help tackle complex and elusive bugs.
-
Remote Debugging: Remote debugging allows you to debug an application running on a different machine or device. This is useful for debugging server-side applications, embedded systems, or mobile apps.
-
Post-Mortem Debugging: Post-mortem debugging involves analyzing a core dump or crash dump to understand the state of the program at the time of the crash. This is useful for debugging crashes that are difficult to reproduce.
-
Reverse Debugging: Reverse debugging allows you to step backward through your code, undoing the effects of previous operations. This can be incredibly helpful for understanding how the program reached a particular state.
-
Profiling: Profiling involves measuring the performance of your code to identify bottlenecks and areas for optimization. Profiling tools can help you identify code that is consuming excessive CPU time or memory.
IV. Choosing the Right Tool for the Job
The best debugging tool depends on the specific problem you’re trying to solve, the programming language you’re using, and the environment you’re working in. Here are some general guidelines:
- For simple bugs and understanding code flow: Print statements and basic IDE debugger features are often sufficient.
- For complex logic and data manipulation: Breakpoints, stepping through code, and inspecting variables are essential.
- For memory-related issues: Memory debuggers like Valgrind or AddressSanitizer are invaluable.
- For network-related issues: Network debuggers like Wireshark or Fiddler are necessary.
- For performance bottlenecks: Profiling tools are essential.
- For preventing bugs before they happen: Static analysis tools are a great investment.
V. Best Practices for Effective Debugging
- Understand the Problem: Before you start debugging, make sure you understand the problem you’re trying to solve. Reproduce the bug, gather as much information as possible, and formulate a hypothesis about the cause.
- Isolate the Problem: Try to isolate the problem to a specific area of your code. This will make it easier to find the source of the error.
- Simplify the Problem: If possible, simplify the problem by reducing the amount of code involved. This can make it easier to understand the flow of execution and identify the root cause.
- Use a Systematic Approach: Don’t just randomly try different things. Use a systematic approach to debugging, such as stepping through the code, inspecting variables, and evaluating expressions.
- Document Your Findings: Keep track of your findings as you debug. This will help you avoid repeating mistakes and will make it easier to explain the problem to others.
- Test Your Fixes: After you’ve fixed the bug, make sure to test your fix thoroughly. This will help ensure that the bug is actually fixed and that you haven’t introduced any new bugs.
- Learn from Your Mistakes: Debugging is a learning process. Pay attention to the mistakes you make and try to learn from them. This will help you become a more effective debugger in the future.
FAQ
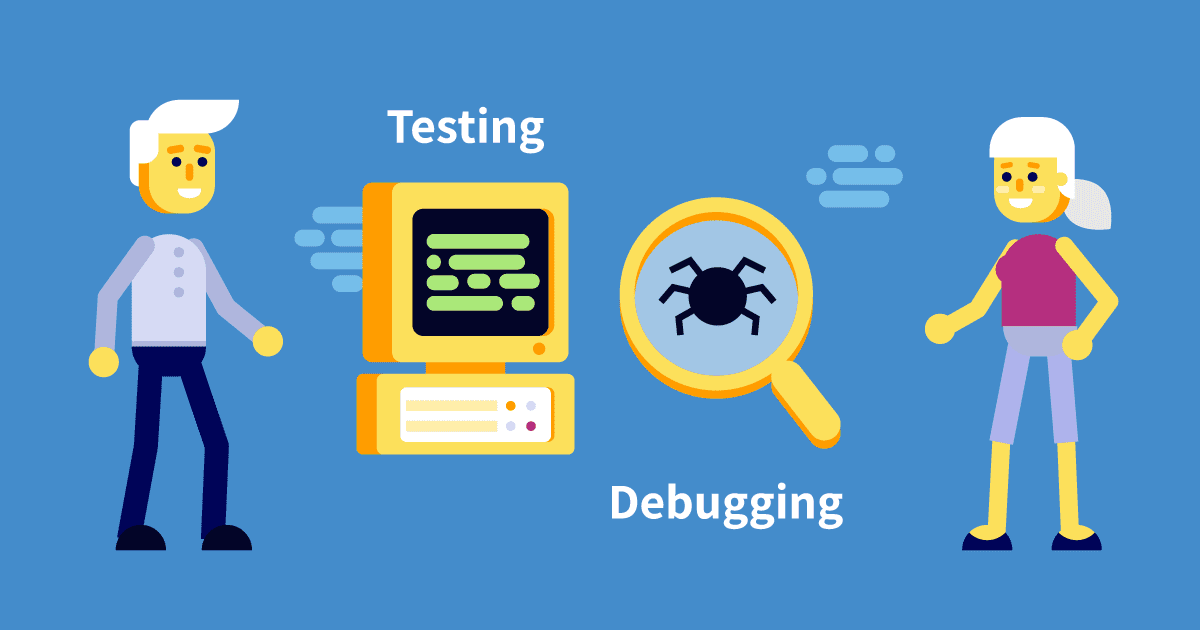
Q: What is the difference between debugging and testing?
A: Debugging is the process of finding and fixing errors in software, while testing is the process of verifying that the software meets its requirements. Testing is used to find bugs, while debugging is used to fix them.
Q: What is a breakpoint?
A: A breakpoint is a marker in your code that tells the debugger to pause execution at a specific line. This allows you to inspect the state of the program at that point.
Q: What is stepping through code?
A: Stepping through code allows you to execute your code one line at a time, observing the changes in variable values and the flow of execution.
Q: What is a memory leak?
A: A memory leak occurs when a program allocates memory but fails to release it when it’s no longer needed. This can lead to the program consuming excessive memory and eventually crashing.
Q: What is a static analysis tool?
A: A static analysis tool analyzes code without actually executing it, identifying potential errors, security vulnerabilities, and code quality issues.
Conclusion
Mastering debugging is crucial for any software developer. By understanding the different types of debugging tools available and employing effective debugging techniques, you can significantly reduce the time and effort required to find and fix errors. Remember to choose the right tool for the job, use a systematic approach, and learn from your mistakes. With practice and perseverance, you can become a proficient debugger and build robust and reliable software. As software development evolves, so do the tools and techniques for debugging. Stay curious, keep learning, and embrace the challenge of finding and fixing those pesky bugs!
